
Connect or build the data
Already have a data warehouse? I plug straight in. If not, I build one and set up automatic feeds from your ERP (Vista, CMiC, JDE, Epicor), payroll, CRM and other systems — typically 2–4 weeks before reporting starts.
Custom reporting for Construction and Manufacturing
Job cost, WIP and production reports built around your numbers and your workflows, connected to the systems you already run. They refresh on their own, filter and drill down in a click, and give you back the days spent every month copying, pasting and fixing formulas.
Built to replace
Experience integrating data from
ERP
CRM / Other
Don’t see yours? If it has a database, an API or an export, I can pull from it.
Before and after · demo
A demo on sample data: the Excel report on top is the kind of thing that gets rebuilt by hand every week. Underneath is the same breakdown rebuilt from the same rows — the numbers agree to the cent, and nobody pasted anything.
Before
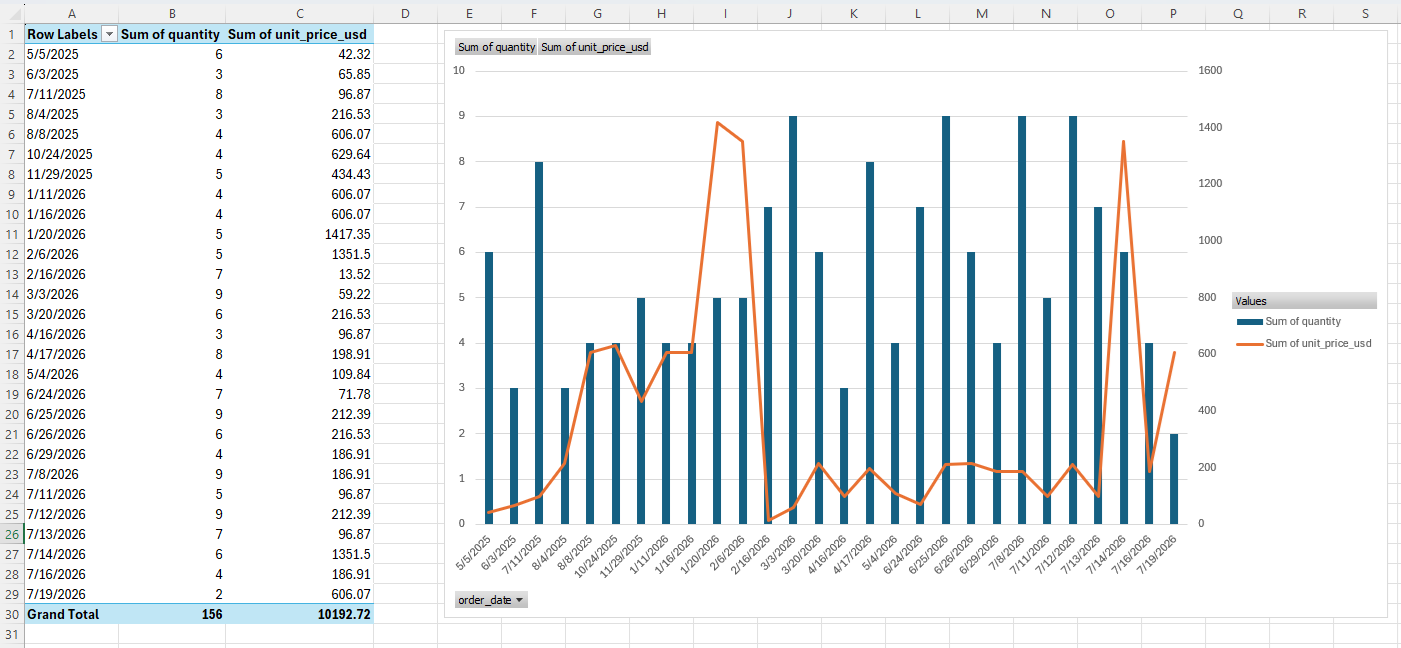
After
Demo — the MVP FastPass version: the same breakdown, live
How it works
Already have a data warehouse? I plug straight in. If not, I build one and set up automatic feeds from your ERP (Vista, CMiC, JDE, Epicor), payroll, CRM and other systems — typically 2–4 weeks before reporting starts.
A short discovery session gives me what I need to turn the idea into a first version. Show or tell me how you want the report to look and function; I’ll share ideas and explain how each option affects price and timeline. You get a first look at your first report 1–2 weeks after I’m connected to your data.
Your first working report goes live with the right people having the right access. Changes take days, not weeks and tickets. Editable notes, forecasts and custom fields are included, so the report grows with the team.
What it looks like · live demos
Every sample sales order, with its quantity, price, margin and shipping status, sorted, filtered and exported in the browser. The kind of register that usually lives in a spreadsheet emailed around before every gate review or job-cost meeting — try the column filters, they are the real ones.
Revenue by product category against customer segment, shaded so the big numbers stand out, with totals on both edges. The month-end Excel pivot, except it refreshes itself and nobody has to rebuild it.
The same rows ranked rather than totaled: which product categories bring in the most revenue, largest first, so the answer is read off the top of the chart instead of hunted for in a legend.
What you get
Already have a warehouse? I work inside it. No warehouse yet? I stand one up and build the pipelines that keep it fresh, so every report reads the same numbers instead of whichever export someone pulled last.
Charts that filter each other, grids that sort, group, and export, and drill-downs that go from the summary to the row in one click.
Add notes, flags, forecasts, and custom fields right in the report. It's stored properly, audited, and available to every other report — not in someone's local copy.
Who can see which rows, who can edit which fields, who can approve. Row-level and field-level, tied to your existing logins.

Who you'll be working with
I'm Dominic. I scope the project, build the warehouse and the pipelines, write the reporting app, and answer the email when something needs changing. There is no account manager between you and the person doing the work.
I bring multiple years of experience with over a dozen Construction and Manufacturing companies, building reporting, data warehouses and ETL around the spreadsheets those businesses run on. MVP FastPass turns that experience into a running app in your hands in weeks, not quarters.